The global market for neurotechnology is expected to grow in the coming years, with the potential to generate significant economic benefits. The UK’s Regulatory Horizons Council (RHC) notes that:
“Neurotechnology is predicted to become a significant market with the potential to generate substantial economic benefits, valued at US$17.1 billion globally by 2026, with the largest segments being neuromodulation, neuroprosthetics and neurosensing.”16
While there are a range of estimates available on the overall size of the neurotechnology market,17 you should treat these with a degree of caution.
An OECD paper18 highlights the potential economic value of neurotechnology in the healthcare sector. For example, neurotechnology has the potential to deliver treatments for diseases causing progressive decline in brain functionality, including dementia. Dementia currently affects 50 million people worldwide at an estimated cost of $1 trillion per year.19 Other health conditions that could potentially benefit from neurotechnology include:
- Parkinson’s disease;
- dementia;
- depression;
- heart and circulatory disease;
- rheumatoid arthritis; and
- stroke survivors20.
Public and private sector activity
Public Sector
Between 2011 and 2020, the UK publicly invested around £98 million ($111 million) in research funding for neurotechnology.21 This funding was split amongst 251 research projects across all regions of the UK. It was largely in academic institutions such as universities, with the largest concentration being in London and the Southeast (22%).
Despite funding neurotechnology research at an earlier stage, international comparisons show that UK public investment lags other developed economies in absolute and relative terms.
Table 1 shows the scale of public investment in neurotechnology across a range of countries. This includes eight of the 10 largest economies in the world and therefore is likely to capture a high proportion of global public investment in neurotech.22
Table 1: Public sector investment by country
Country |
Value of Public Investment |
Duration of the investment |
Annually (to nearest million) |
Investment as a percentage of GDP23 |
|
USA |
$3.3 billion |
2013 to 2023 |
$300 million |
0.0014 |
|
EU |
$1.08 billion |
2013 to 2023 |
$98 million |
0.0006 |
|
Korea, Republic of |
$42 million |
2021 |
$42 million |
0.0025 |
|
Australia |
$350 million |
2016 to 2020 |
$70 million |
0.0050 |
|
Japan |
$307 million |
2014 to 2024 |
$28 million |
0.0005 |
|
Canada |
$171 million |
2011 to 2019 |
$19 million |
0.0011 |
|
UK |
$111 million |
2011 to 2020 |
$11 million |
0.0004 |
Source: KTN (2021), ICO analysis
UKRI’s 2021 Knowledge Transfer Network (KTN) report also identified a programme of public investment in China. While the size and duration of this investment is unknown, KTN expect it to be ‘substantial’.24
Private Sector
Limited data is available on the number of private sector companies involved in neurotechnology, particularly in the UK. To address this, we have estimated by using FactSet, a data set that compiles information on companies globally from publicly available data sources. We have also been unable to source data on the relevant organisations in China.
We defined number of tags, or search terms, to identify the business activities of firms that are likely to be involved in the neurotechnology sector.25 Table 2 lists the 10 countries with the greatest number of firms operating in the sector, based on FactSet data. Our analysis found that the UK comes in second, with 39 companies in the UK working on neurotechnology development. The United States has the largest population of domestic companies involved in neurotechnology. We were not able to find any evidence of the size of these companies.
Please note that no data was available on the value of private sector investment.
Table 2: Number of firms by country, top 10 globally
Country |
Number of firms |
|
United States |
386 |
|
United Kingdom |
39 |
|
Canada |
34 |
|
Germany |
22 |
|
Israel |
20 |
|
Switzerland |
19 |
|
France |
17 |
|
Italy |
14 |
|
Australia |
12 |
|
Spain |
10 |
Source: ICO analysis of FactSet data
Patents
Patents are an alternative measure of private sector activity. They are often used as a proxy for innovation, as well as an indicator of investment in research and development. We gathered data from Lens.org to provide up-to-date analysis.
The database search uses a range of parameters. We considered the country of the inventor to be the best indicator of activity within a country, rather than the area of jurisdiction in which the patent was filed, as multiple patents can be filed. We therefore assumed that inventors make decisions about where to file for a patent based on a myriad of factors.
We used a broad range of search criteria and captured patents from all sectors. As a result, we found a greater number of patents than studies focused on health.26 We examined data from 2013 to 2022, in order to show the current state of the market and recent growth in activity. We searched the following terms:
- neurotechnology
- neurotech
- neuromodulation
- neuroprosthetic
- neurorehabilitation
- neurosensing
- neuroimaging
- brain-computer interface
We’ve set out the three metrics below that gave us insight into private sector activity.
We found that over the past 10 years there has been a three-fold increase in the number of patents granted for neurotechnology annually. In that period, UK inventors were granted 1,780 patents (2.8%), as evidenced in Table 3 below.
Table 3: Patents granted by country of inventor globally, 2013 to 2022
Country |
2013 |
2014 |
2015 |
2016 |
2017 |
2018 |
2019 |
2020 |
2021 |
2022 |
Total |
| United States | 2,709 | 3,085 | 3,214 | 3,765 | 4,176 | 4,450 | 5,916 | 6,345 | 6,566 | 6,661 | 46,887 |
| Germany | 114 | 139 | 148 | 177 | 235 | 280 | 324 | 343 | 340 | 323 | 2,423 |
| Canada | 156 | 143 | 135 | 191 | 192 | 205 | 299 | 316 | 327 | 341 | 2,305 |
| United Kingdom | 111 | 114 | 94 | 128 | 139 | 143 | 217 | 264 | 291 | 279 | 1,780 |
| Korea, Republic of | 20 | 56 | 91 | 124 | 158 | 206 | 248 | 307 | 316 | 398 | 1,924 |
| Japan | 117 | 141 | 136 | 139 | 173 | 171 | 259 | 277 | 329 | 289 | 2,013 |
| China | 24 | 36 | 37 | 72 | 102 | 105 | 176 | 222 | 250 | 342 | 1,366 |
| Israel | 109 | 107 | 139 | 125 | 154 | 197 | 192 | 220 | 262 | 303 | 1,808 |
| Switzerland | 39 | 53 | 53 | 71 | 87 | 108 | 128 | 154 | 156 | 175 | 1,024 |
| Netherlands | 47 | 87 | 63 | 80 | 86 | 111 | 136 | 159 | 131 | 163 | 1,063 |
| Rest of the world | 45 | 68 | 91 | 67 | 105 | 138 | 123 | 122 | 160 | 76 | 995 |
| Total | 3,491 | 4,029 | 4,201 | 4,939 | 5,607 | 6,114 | 8,018 | 8,729 | 9,128 | 9,350 | 63,606 |
To consider the importance of the sector to each country, we calculated the number of patents granted by country on a per capita basis. This allowed us to compare countries with different populations.
Figure 1 below shows the number of patents granted by the country of the inventor per 1,000,000 of population. There has been a small increase in UK inventors working on patents for neurotechnology. However, on a per capita basis, the UK’s contribution to this field is small in comparison. This suggests the UK is not attracting the same level of private sector interest as other countries.
Figure 1: Patents granted by country of inventor per million population, 2013 to 2021
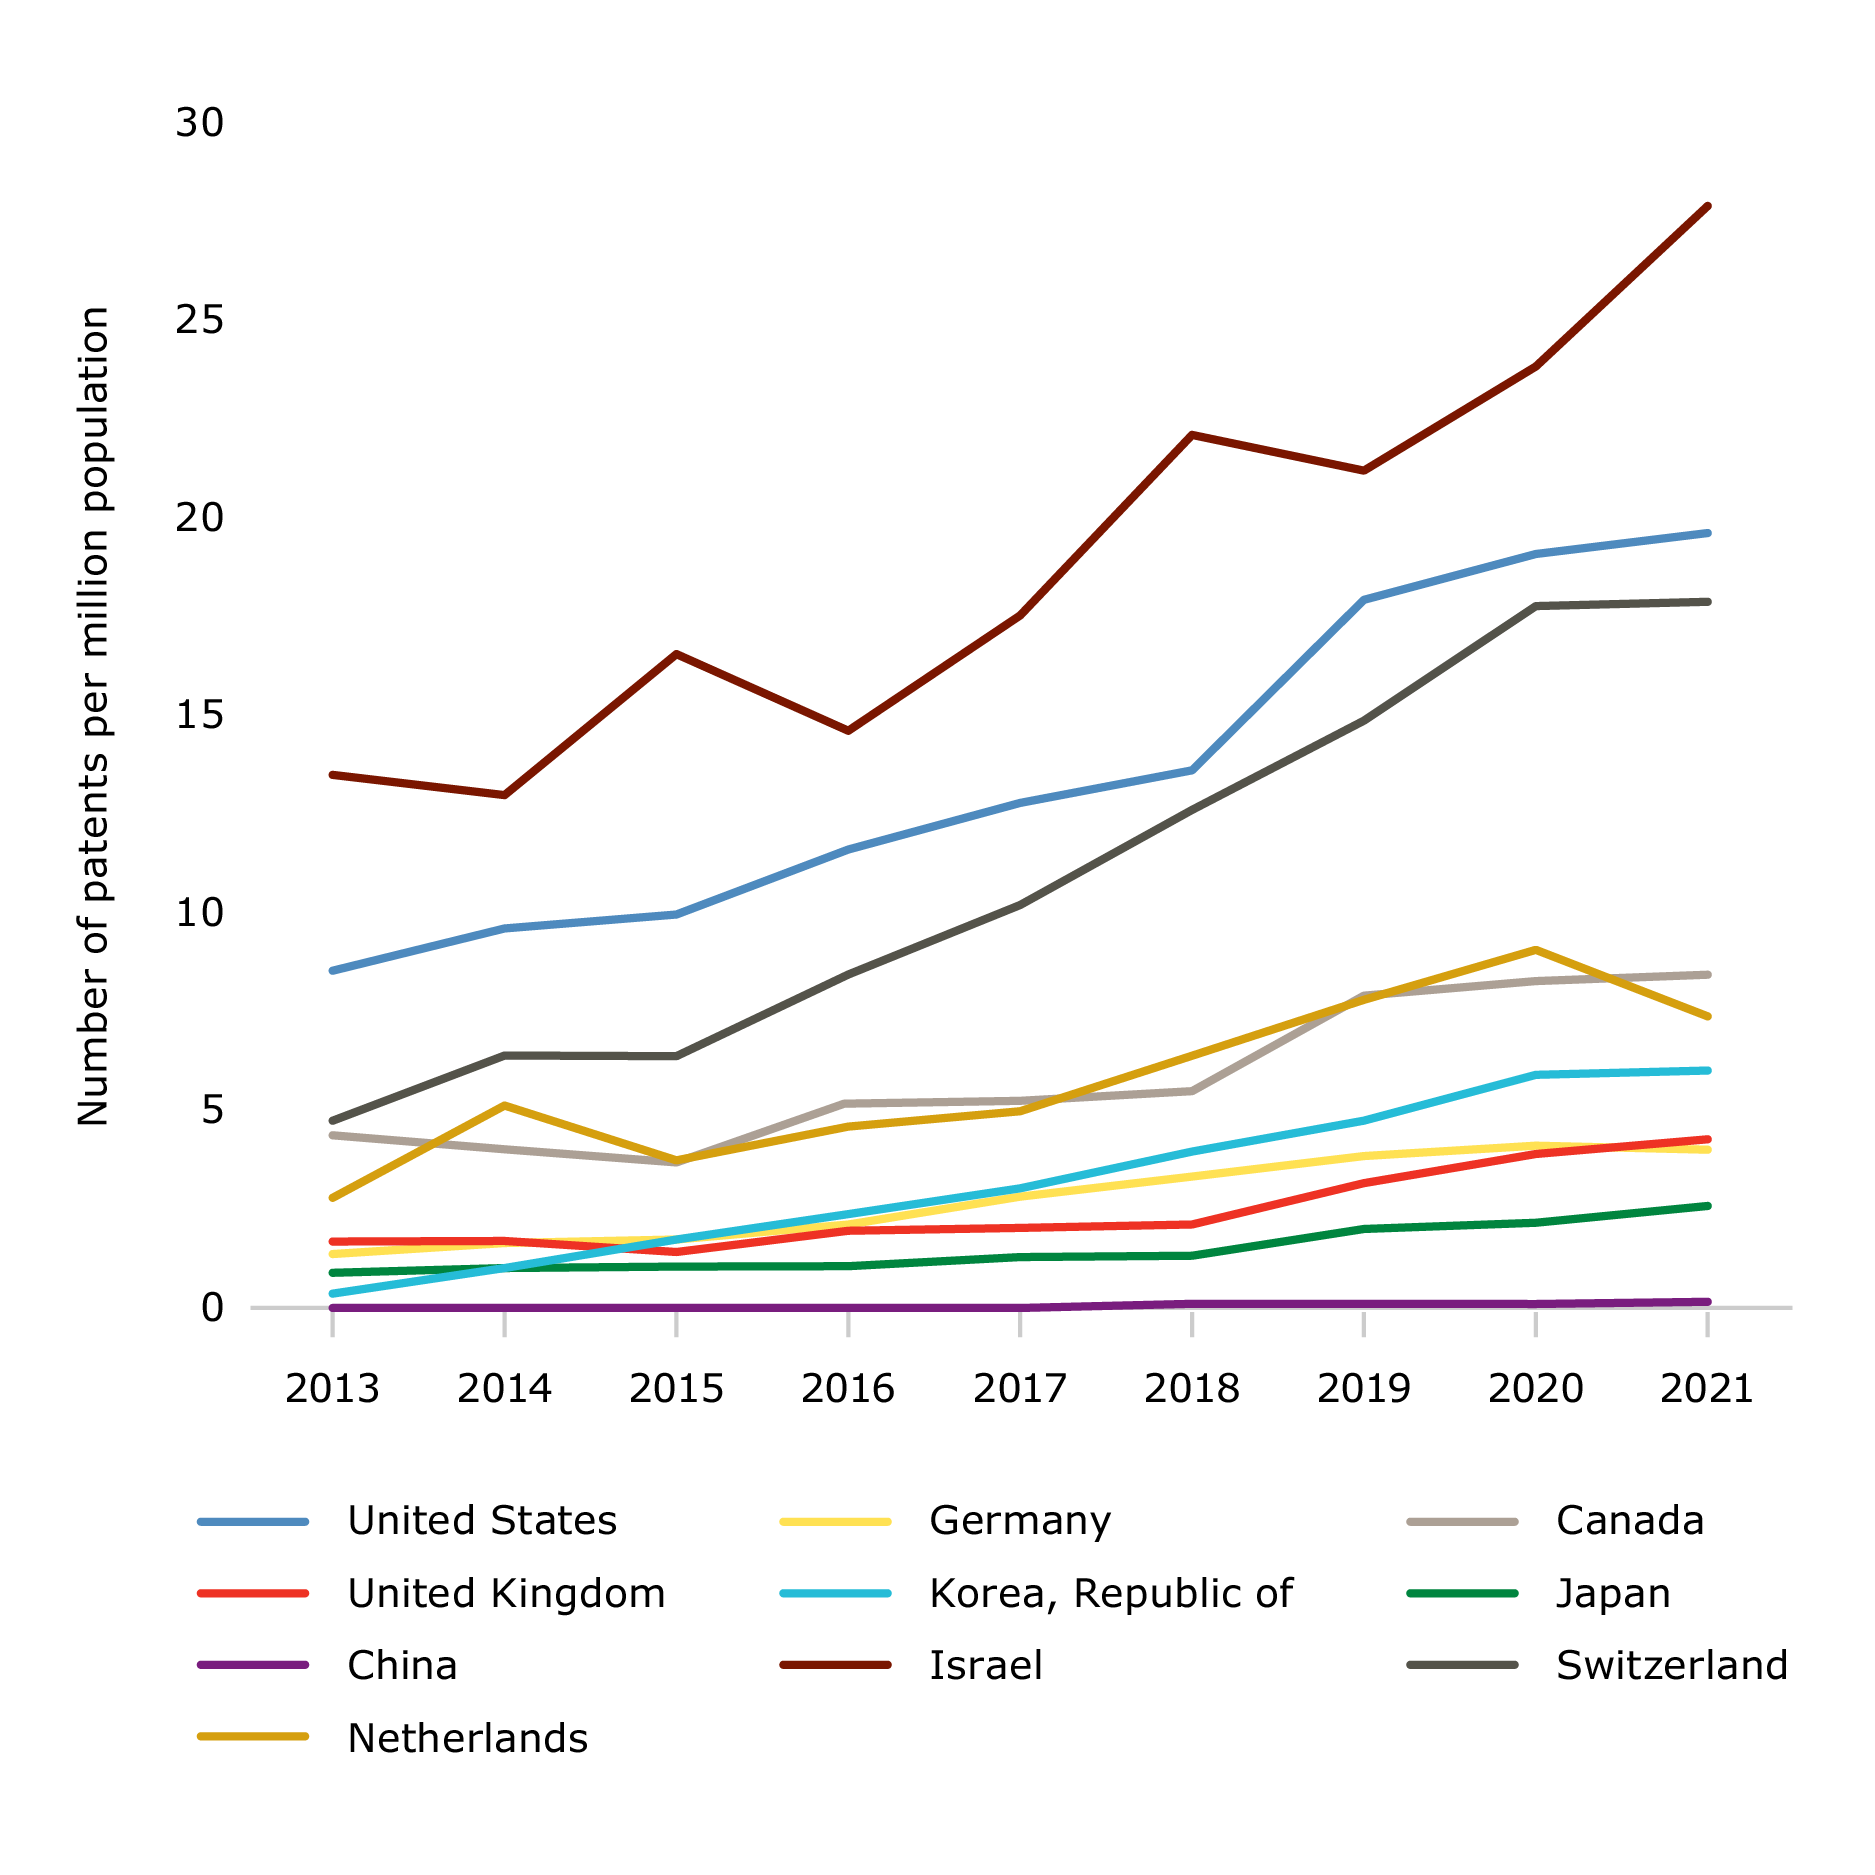
Source: ICO analysis of lens.org data.
Although China’s contribution on a per capita basis is very small, in absolute terms it is significant at 342 in 2022. This is the third highest number amongst this cohort.
This following metric captures the number of inventors by country of residence. This may be a better indicator of the quality of human capital available to each country than capturing the number of patents in metrics 1 and 2.
By this measure, the UK lags its competitors suggesting that comparable countries may have greater human capital in the sector.
Table 4: Inventors of patents around neurotechnology by country, 2013 to 2022
Country |
Number of inventors |
Population (2021) |
Inventors per 100,000 population |
|
United States |
53,794 |
331,894,000 |
16.2 |
|
Germany |
4,200 |
83,196,000 |
5.0 |
|
Canada |
3,710 |
38,246,000 |
9.7 |
|
United Kingdom |
3,393 |
67,327,000 |
5.0 |
|
Korea, Republic of |
3,318 |
51,745,000 |
6.4 |
|
Japan |
2,980 |
125,682,000 |
2.4 |
|
China |
2,743 |
1,412,360,000 |
0.2 |
|
Israel |
2,274 |
9,364,000 |
24.3 |
|
Switzerland |
1,903 |
8,703,000 |
21.9 |
|
Netherlands |
1,827 |
17,345,000 |
10.5 |
Source: ICO analysis of lens.org data
16 RHC (2022)
17 For example see: The Market for Neurotechnology: 2022-2026 - Research and Markets; Global Neurotechnology Market Report 2022: Products will be $8.4 Billion in 2018 and will Reach $13.3 Billion in 2022 - Forecast to 2026 - ResearchAndMarkets.com | Business Wire; Global Neurotechnology Market Report 2022-2026 - New Product Categories in Neurorehabilitation and Neurosensing Such as Brain Analysis Systems and Neurorobotics Systems (prnewswire.com)
18 9685e4fd-en.pdf (oecd-ilibrary.org)
19 ibid, p12
20 KTN (2021): A-transformative-roadmap-for-neurotechnology-in-the-UK.pdf (ktn-uk.org)
21 URKI: https://iuk.ktn-uk.org/programme/neurotechnology-landscape/
22 KTN (2021): A-transformative-roadmap-for-neurotechnology-in-the-UK.pdf (ktn-uk.org)
23 Annual investment as a percentage of 2019 GDP: GDP (current US$) | Data (worldbank.org)
24 KTN (2021): A-transformative-roadmap-for-neurotechnology-in-the-UK.pdf (ktn-uk.org), p12
25 We cross-referenced the following tags against business activities in FactSet to identify companies likely to be involved in neurotech: neurotechnology; neurosensing; neuroimaging; neuromodulation; neuroprosthetics and neurorehabilitation.
26 We noted that terminology shifts across time and countries, meaning that we were not able to completely survey all relevant patents relating to neurotechnology and the shift in the function of associated terminology.